When I bought my first house in February 2025, and started shopping around for the best mortgage rates, I followed my mortgage broker's advice and went for a variable home loan; the broker said that because I could fix the loan at any time, I may as well start variable. Once the home loan commenced in April, I started paying closer attention to the news on interest rate decisions, and after a month or two I came across the RBA rate tracker, which shows the futures market predictions of rates. From it I could see that interest rates for home loans were closely following their expected path downwards, both fixed and variable drifting down in sync month on month.
Several months into making the mortgage repayments, in October 2025, inflation for the quarter was reported much higher than expected, a surprise that matters because it directly feeds the market's interest rate outlook. This suddenly caused the futures market to price in three cash rate increases, when just the week before there had been no forecast change at all. The banks hadn't adjusted their fixed offerings, and I was trying to make sense of it.
My working hypothesis: bond markets are efficient at predicting rates in a way that bank pricing isn't. Bond markets have a built-in correction mechanism: if the price of a bond doesn't reflect the best available prediction of the cash rate, there's a profit opportunity in trading it, and that pressure pushes the price back toward the accurate value. Banks don't have that same incentives built into how they set fixed rates. They want a rate they can advertise and hold steady, not one that shifts with every data print, so there's less pressure for their pricing to track rate expectations closely or quickly. That's why I'd expect the bond market to be the more accurate, faster-moving predictor of where the cash rate is headed. I was becoming increasingly convinced there was an opportunity to fix at a lower rate before the expected increases hit, and that there should be an empirical method for working out when fixing beats staying variable.
When choosing between a fixed or variable home loan, the premise is simple: fixing is a bet that, over the period you fix for, the interest you'd pay on the variable rate works out higher than on the fixed rate. We already know the fixed rate, that's what the bank is quoting us, so the question comes down to what the variable rate will do over the fixed period.
Banks' variable rates broadly track the cash rate plus a margin, since a bank can always fund an additional loan at the cash rate. To predict the variable rate, I make a simplifying assumption that the gap between the variable rate and the cash rate stays constant over time (an assumption I'll come back and test later). With that assumption, predicting the variable rate reduces to predicting the cash rate. The easiest way to get a prediction for that is the yield on government bonds. Bond yields work as a predictor because they reflect the market's expectation of the average cash rate over the bond's life, plus a small term premium; if the market expects rates to fall, 1-year bond yields fall with them. So now we have a clean comparison of the interest we'd pay over the period:
Fixed rate on offer vs 1-year bond yield + current bank margin (Variable - Cash Rate)
Take May 2022, a standout case. At that point, banks were offering a 1-year fixed rate of ~3.30%. The 1-year bond yield was 3.05%, and the bank variable margin was 2.45% (calculated as the variable rate on offer at the time, minus the cash rate at the time), so our expected variable rate over the year was 5.50%:
3.30% fixed vs 5.50% variable (3.05% bond yield + 2.45% margin). A forecast saving of 2.20% a year from fixing. A great time to lock in!
Two views of the next 12 months
To test my hypothesis, I wanted a clean comparison of market expectations of the interest rates vs bank offerings & I wanted to be able to plot that historically. To do this I looked at:
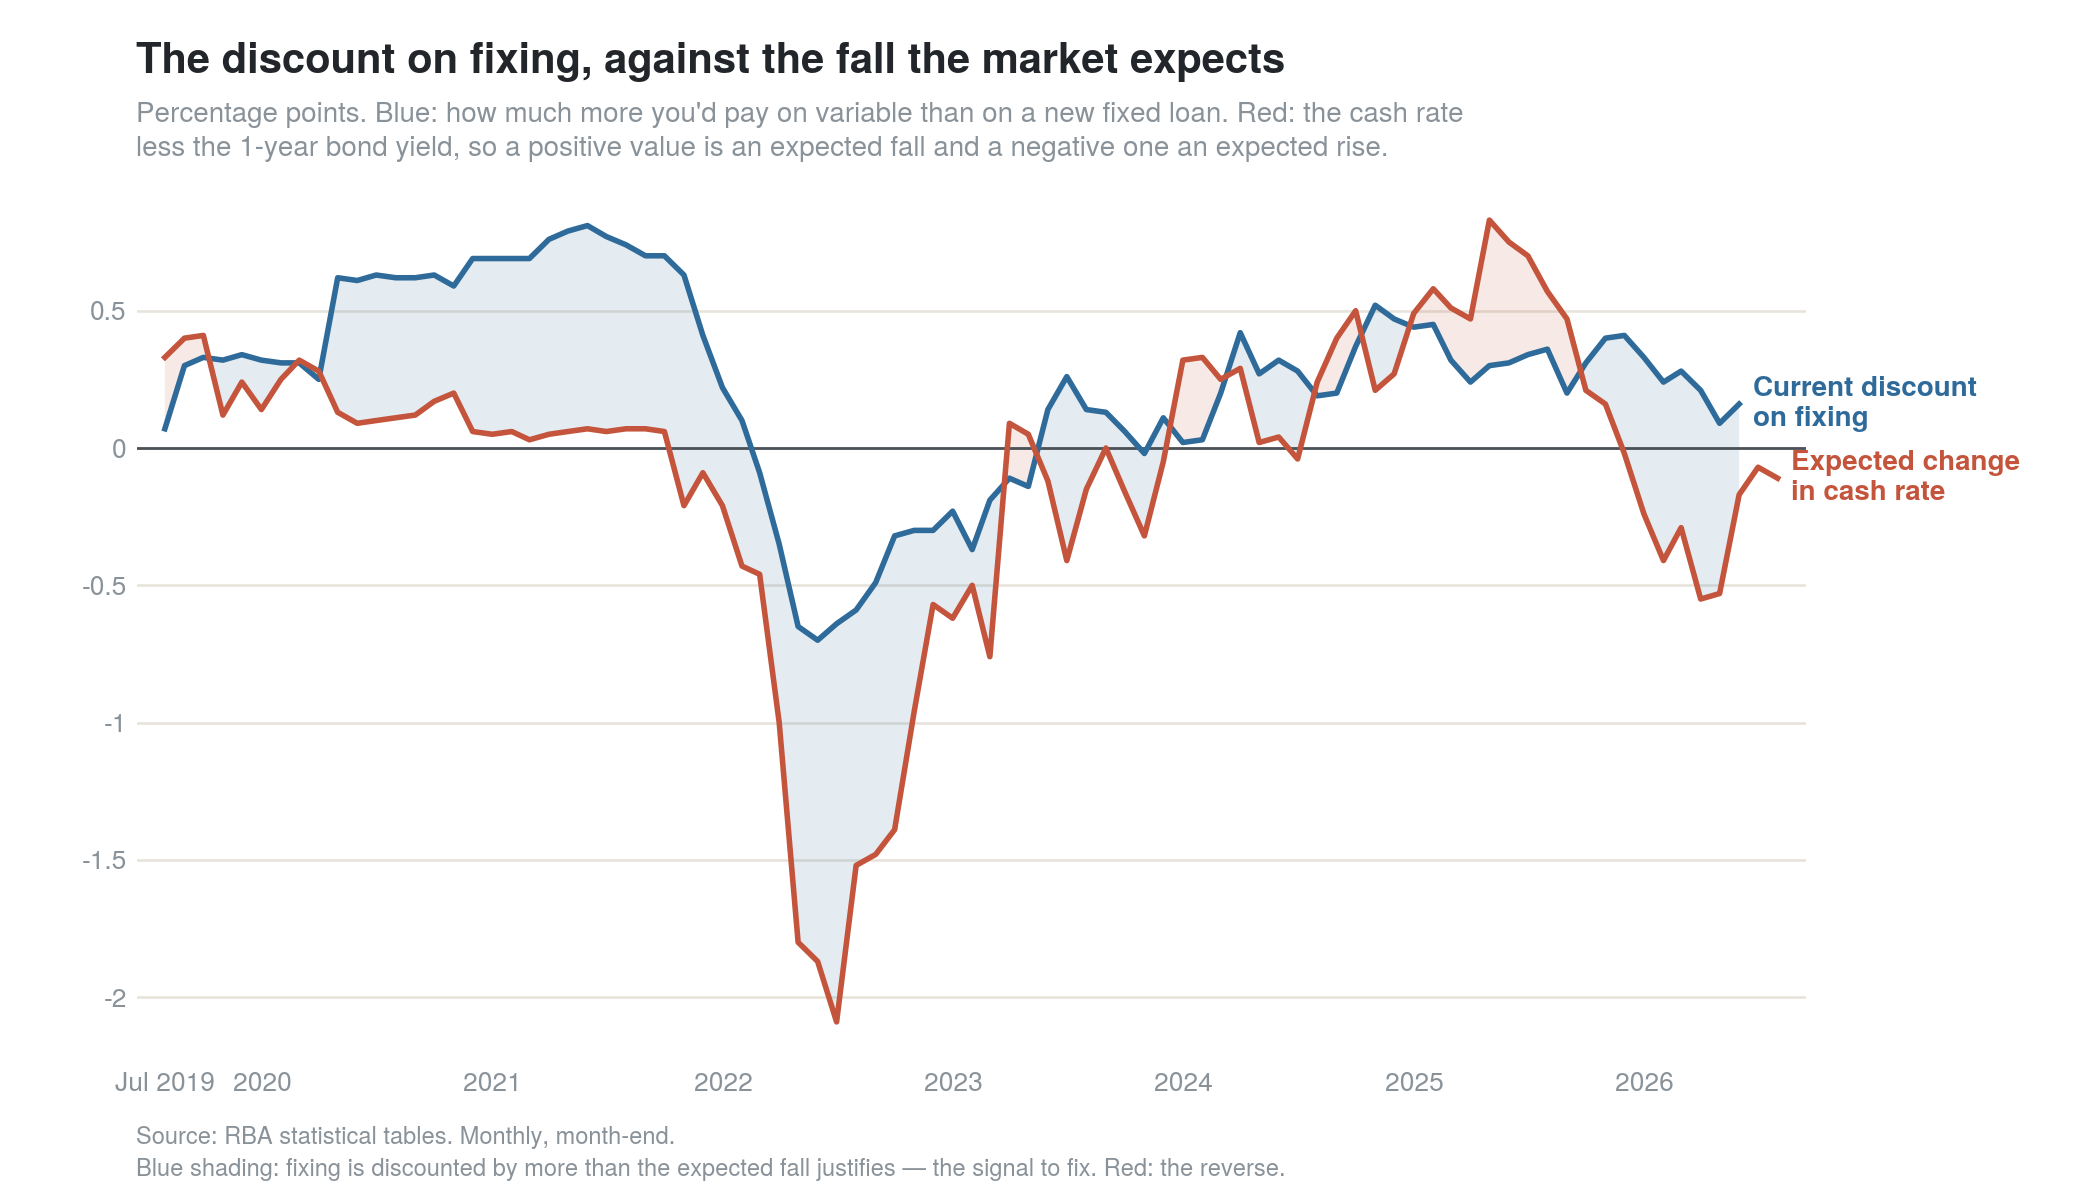
Variable - Fixed rate vs Cash rate - 1Y Bond yield
This is the same comparison as before, just restated as two spreads instead of two rates. The left side is how much more you'd pay on variable compared to fixed, i.e. the discount banks are currently offering on fixed relative to today's variable rate. The right side is how much the bond market expects the cash rate to fall (or rise, if negative) over the same period, relative to where it sits today. When the left side is bigger than the right side, fixing offers a bigger discount than the bond market thinks is justified, and that's your signal to fix.
I first want to plot these against each other to see if they diverge, then if they do diverge we can do a historical analysis & see if following the bond market prediction leads to better, more optimal decision making.
I have calculated the two above metrics from public data the RBA has on its website, specifically the actual rate paid for new fixed & new variable mortgages:
Walking through the divergences
-
Late 2019 through early 2022. The variable rate sits well above the 1-year fixed rate; banks are pricing no hikes into the fixed product, and the bond market agrees, pricing in almost no hikes of its own. So the fixed rate here is correctly low; the real anomaly is on the variable side, where the margin banks are charging looks out of step with the margin on fixed. I'll come back to that gap in more detail later. For now, the metrics show that fixing would have cost you roughly a 1% premium over this period.
-
Mid-2022: the standout. The bond market suddenly priced a wave of hikes, but the banks moved more slowly. At the extreme you could fix at 3.3% while the variable rate was 2.8%, a 0.5% cost on paper, but the bond market was pricing roughly 2.5% of hikes over the next 12 months. Paying 0.5% now to avoid 2.5% over the life of the loan is a no-brainer.
-
January 2023 to early 2024. Roles reverse. The bond market starts pricing cuts; banks don't follow. Fixed rates stayed expensive relative to the bond rate. There is a modest expected premium for staying variable.
-
Mid-2024 to early 2025. The lines move together. Unsurprisingly, this is when bond yields are roughly steady, so there's nothing for the banks to lag behind. Fixed and variable stay in line, exactly what we'd expect if the signal is doing its job: no movement in bond yields, no divergence, no signal either way.
-
Mid-2025 onward. A small inflationary shock. Bond yields jump on expected hikes, banks reprice slowly. You could fix roughly three-quarters of a percent below the implied variable path. This is when I decided to fix after getting my mortgage in February.
A concrete example
On a $1,000,000 loan, a 1% gap between the realised variable rate and the fixed rate you locked in is worth ~$10,000 over twelve months. Because it's interest avoided rather than income earned, that's a $10,000 tax-free benefit from a single decision.
When the mid-2025 signal lit up, I fixed approximately $1.2M at a 0.7% gap to the variable rate. If the signal is right, that's a ~$8,500 tax-free saving over the year. Two minutes staring at two charts; one phone call to the bank.
Does the signal actually work? Backtesting
A theory is only as good as its track record. The RBA publishes both the cash rate and the average variable rate every month, so I can compute the realised benefit of fixing 12 months earlier, i.e. what the borrower actually saved (or lost) by fixing instead of floating. If the bond-market signal is real, expected and realised benefits should move together & be correlated.
Expected benefit = (average implied variable rate over next 12m) − (today's 1Y fixed)
Realised benefit = (actual average variable rate over next 12m) − (1Y fixed locked at start)
The implied variable rate is the 1-year bond yield plus the current variable margin.
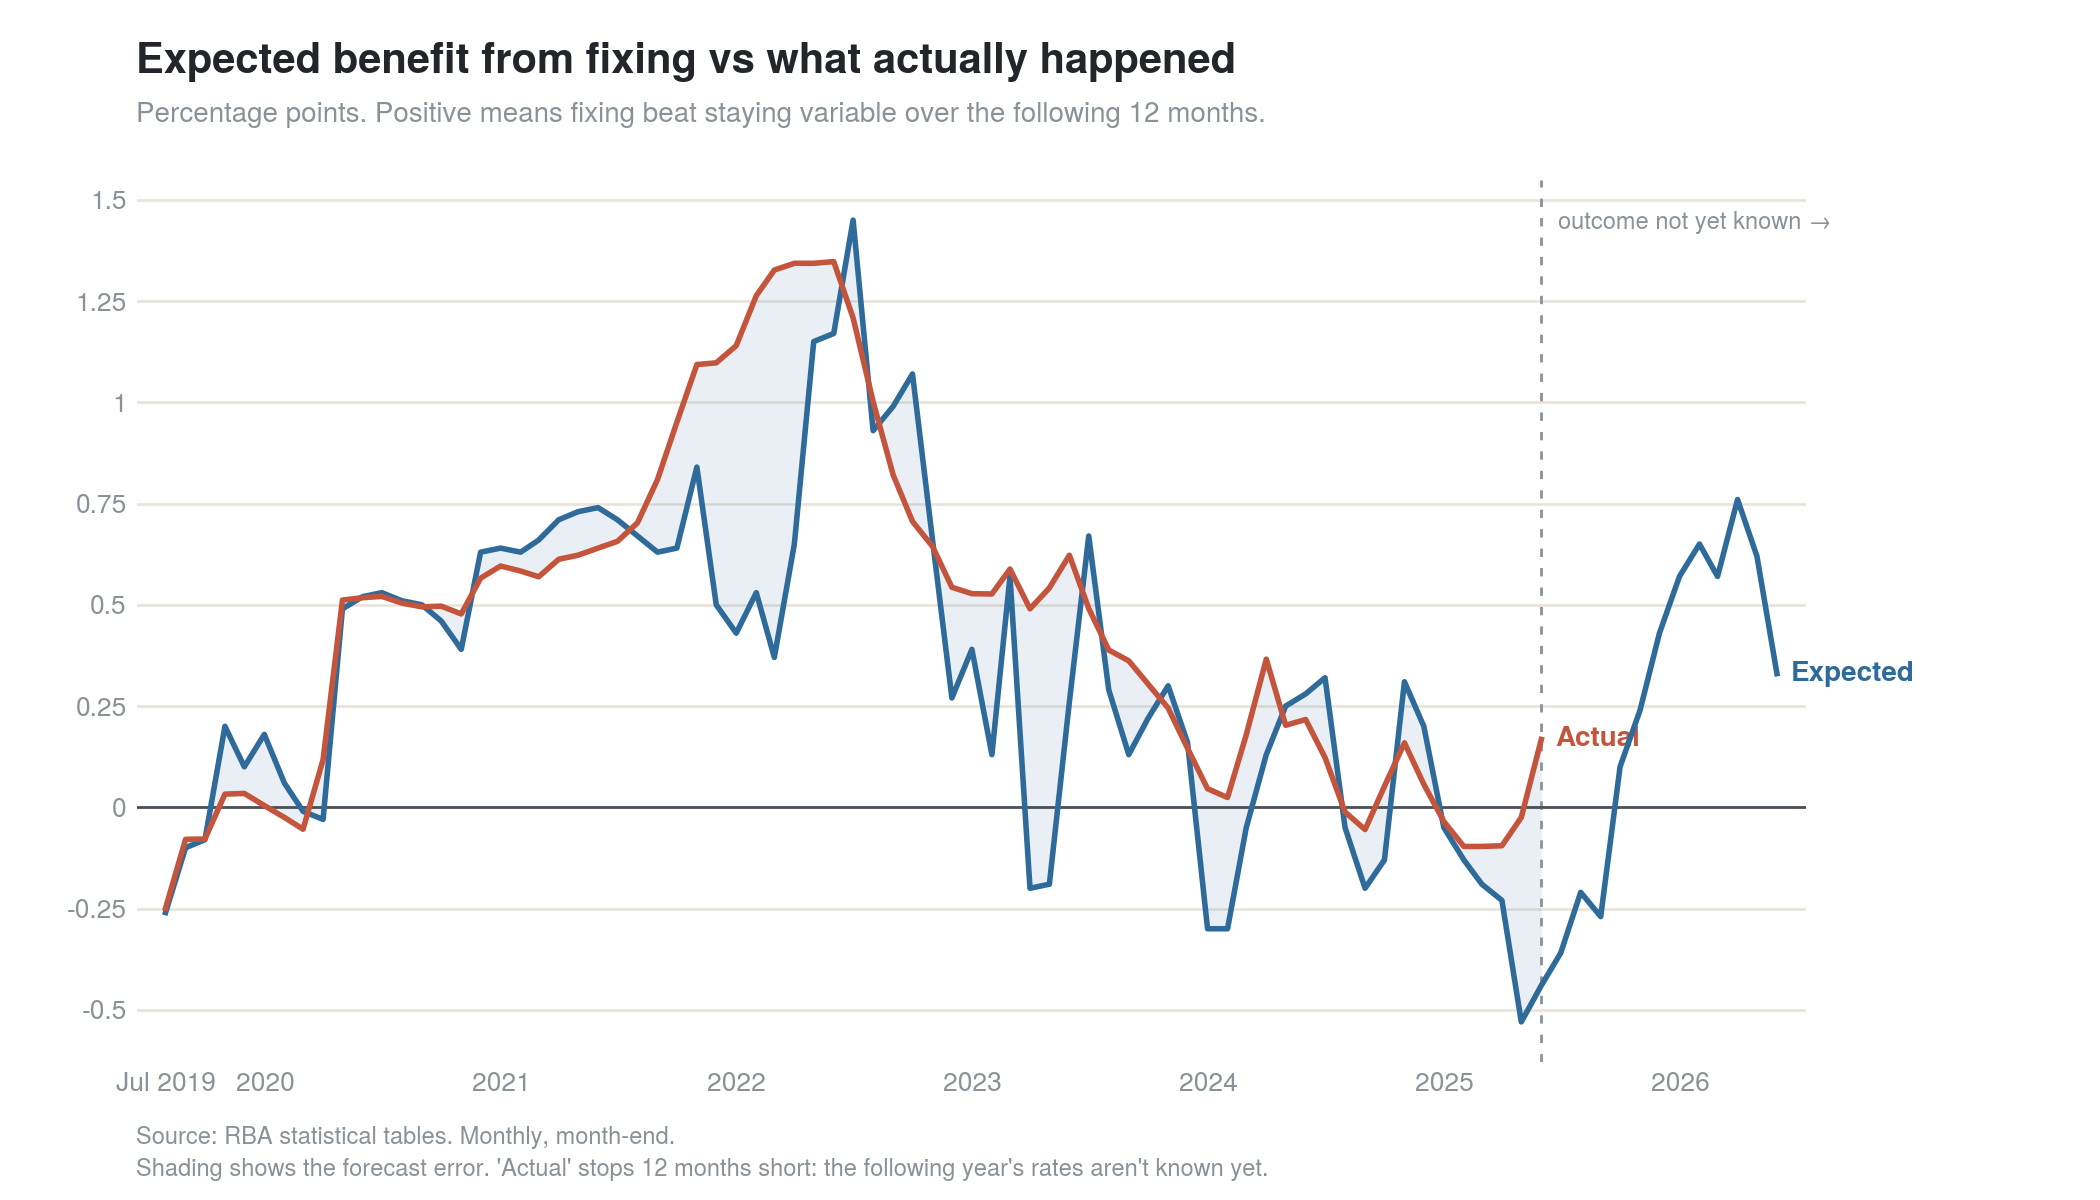
We can see in general it has been quite predictive, the expected benefit noisily moving around the actual benefit. There is one stand-out divergence around 2022 worth pulling apart: is that because banks are slow to reprice, or because they're actively moving their margin around?
Decomposing what we see
To try to understand the margin vs. lag effect, I held the margin fixed at its period average (1.87 percentage points) and used that flat margin plus the 1-year bond yield to predict the fixed rate. If fixed rate pricing lags, we'd expect the fixed curve to sit shifted to the right of the bond curve, and that's exactly what we see post-Covid.
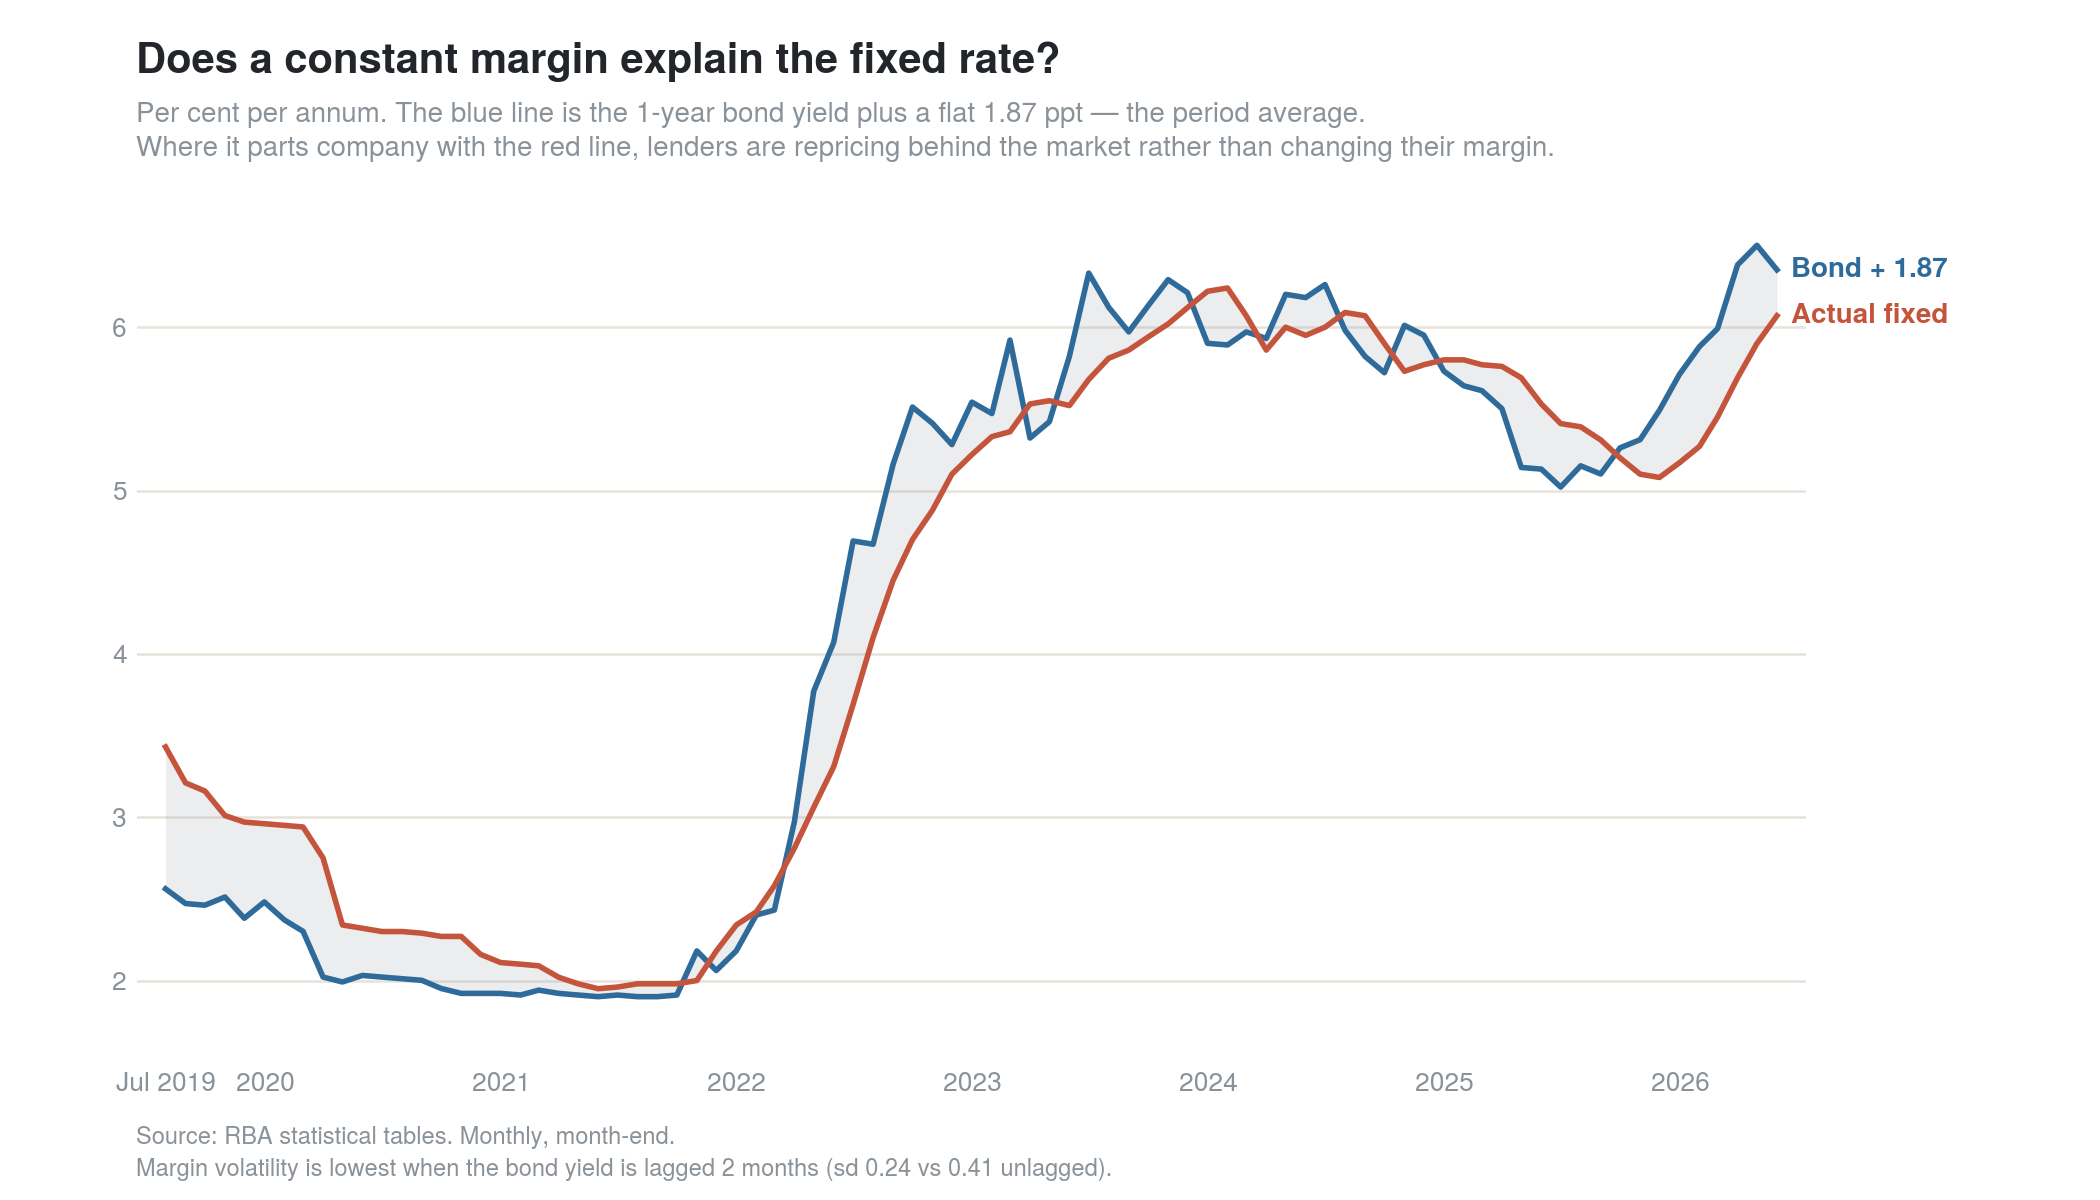
This clearly shows the banks are lagging the bond market by 1-2 months, this is a big part of where the benefit comes from. They lag adjusting their rates into a hiking cycle, giving opportunity to fix on good rates, they also lag cutting rates so there are opportunities when staying variable provides a strategic advantage.
The other component I can see is bank margin. Banks don't pass through every cash rate change one-for-one. They use the cash rate cycle to manage their net interest margin. Widening it when they can get away with it, compressing it when competitive pressure forces them to.
The issue we have is while we can directly see the margin for variable loans, we can't isolate the bank margins or pricing errors for fixed. I have tried to smooth & pull out the fixed margin against the variable. To try & get a comparable fixed margin I have used the new fixed rate less the 1-year bond yield, then smoothing over three months. While this isn't a very rigorous approach, you can see that the margin between fixed and variable have normalised post covid:
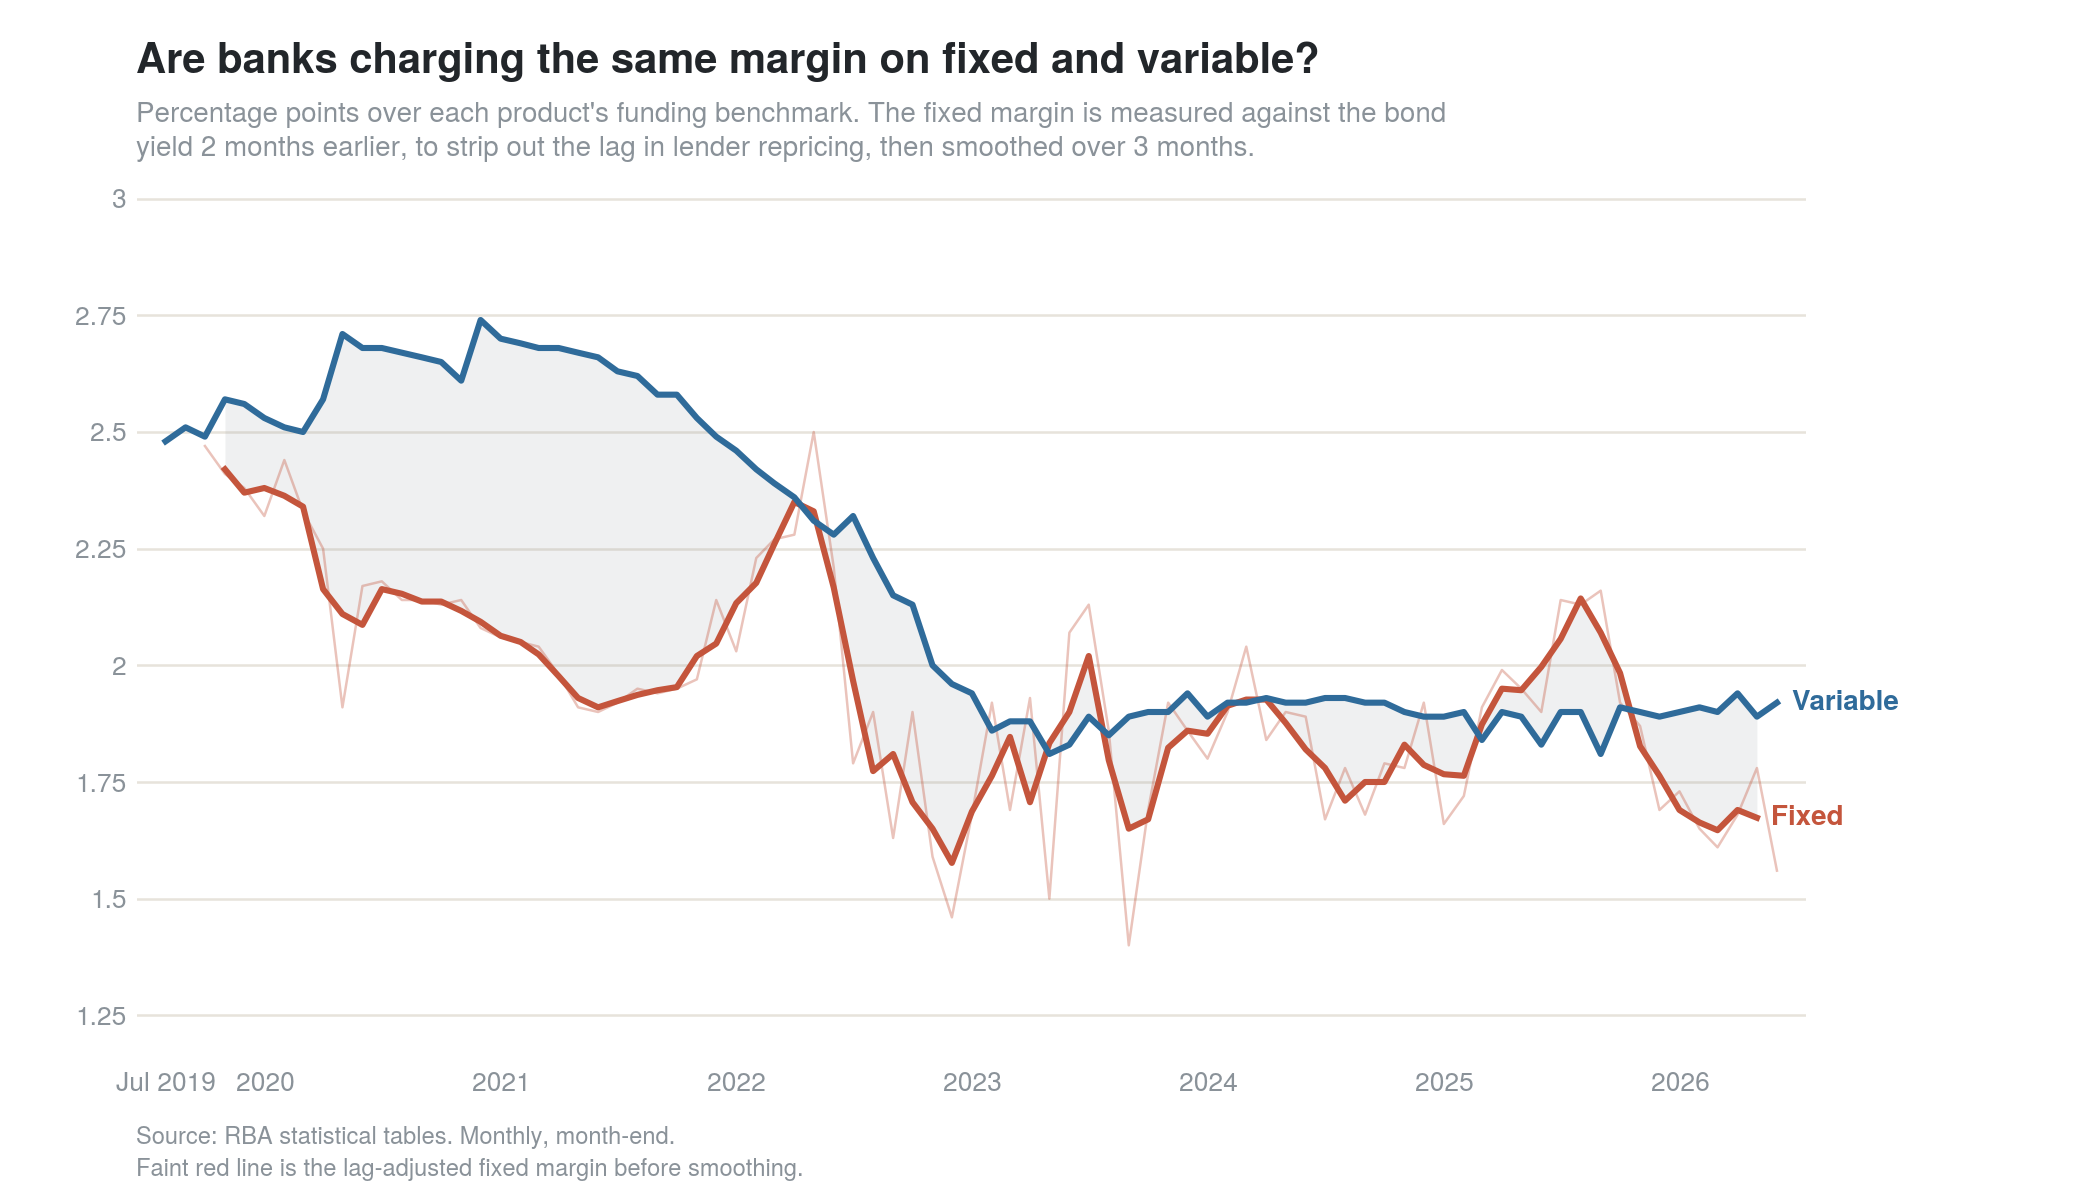
In 2021 & 2022, fixed bank margin was materially below variable. Borrowers on fixed rates got a material discount. They also got subsequent benefit from the hiking cycle at the end of covid, creating a scenario we are unlikely to see repeated of systematic benefits of fixing.
Since early 2023 the margin has stabilised across both, and we only see the benefits of the banks lagging.
How accurate is the signal?
An easy way to understand the relationship between expected and realised benefit is a scatter plot, the expected value we calculated earlier vs the 12-month actuals after the fact, one dot per month. A perfectly accurate signal would have every dot on the 45° line. Same-sign dots, in the top-right or bottom-left quadrants, are decisions the signal got directionally right; cross-quadrant dots are misses. The two are strongly correlated, with a correlation coefficient of 0.62.
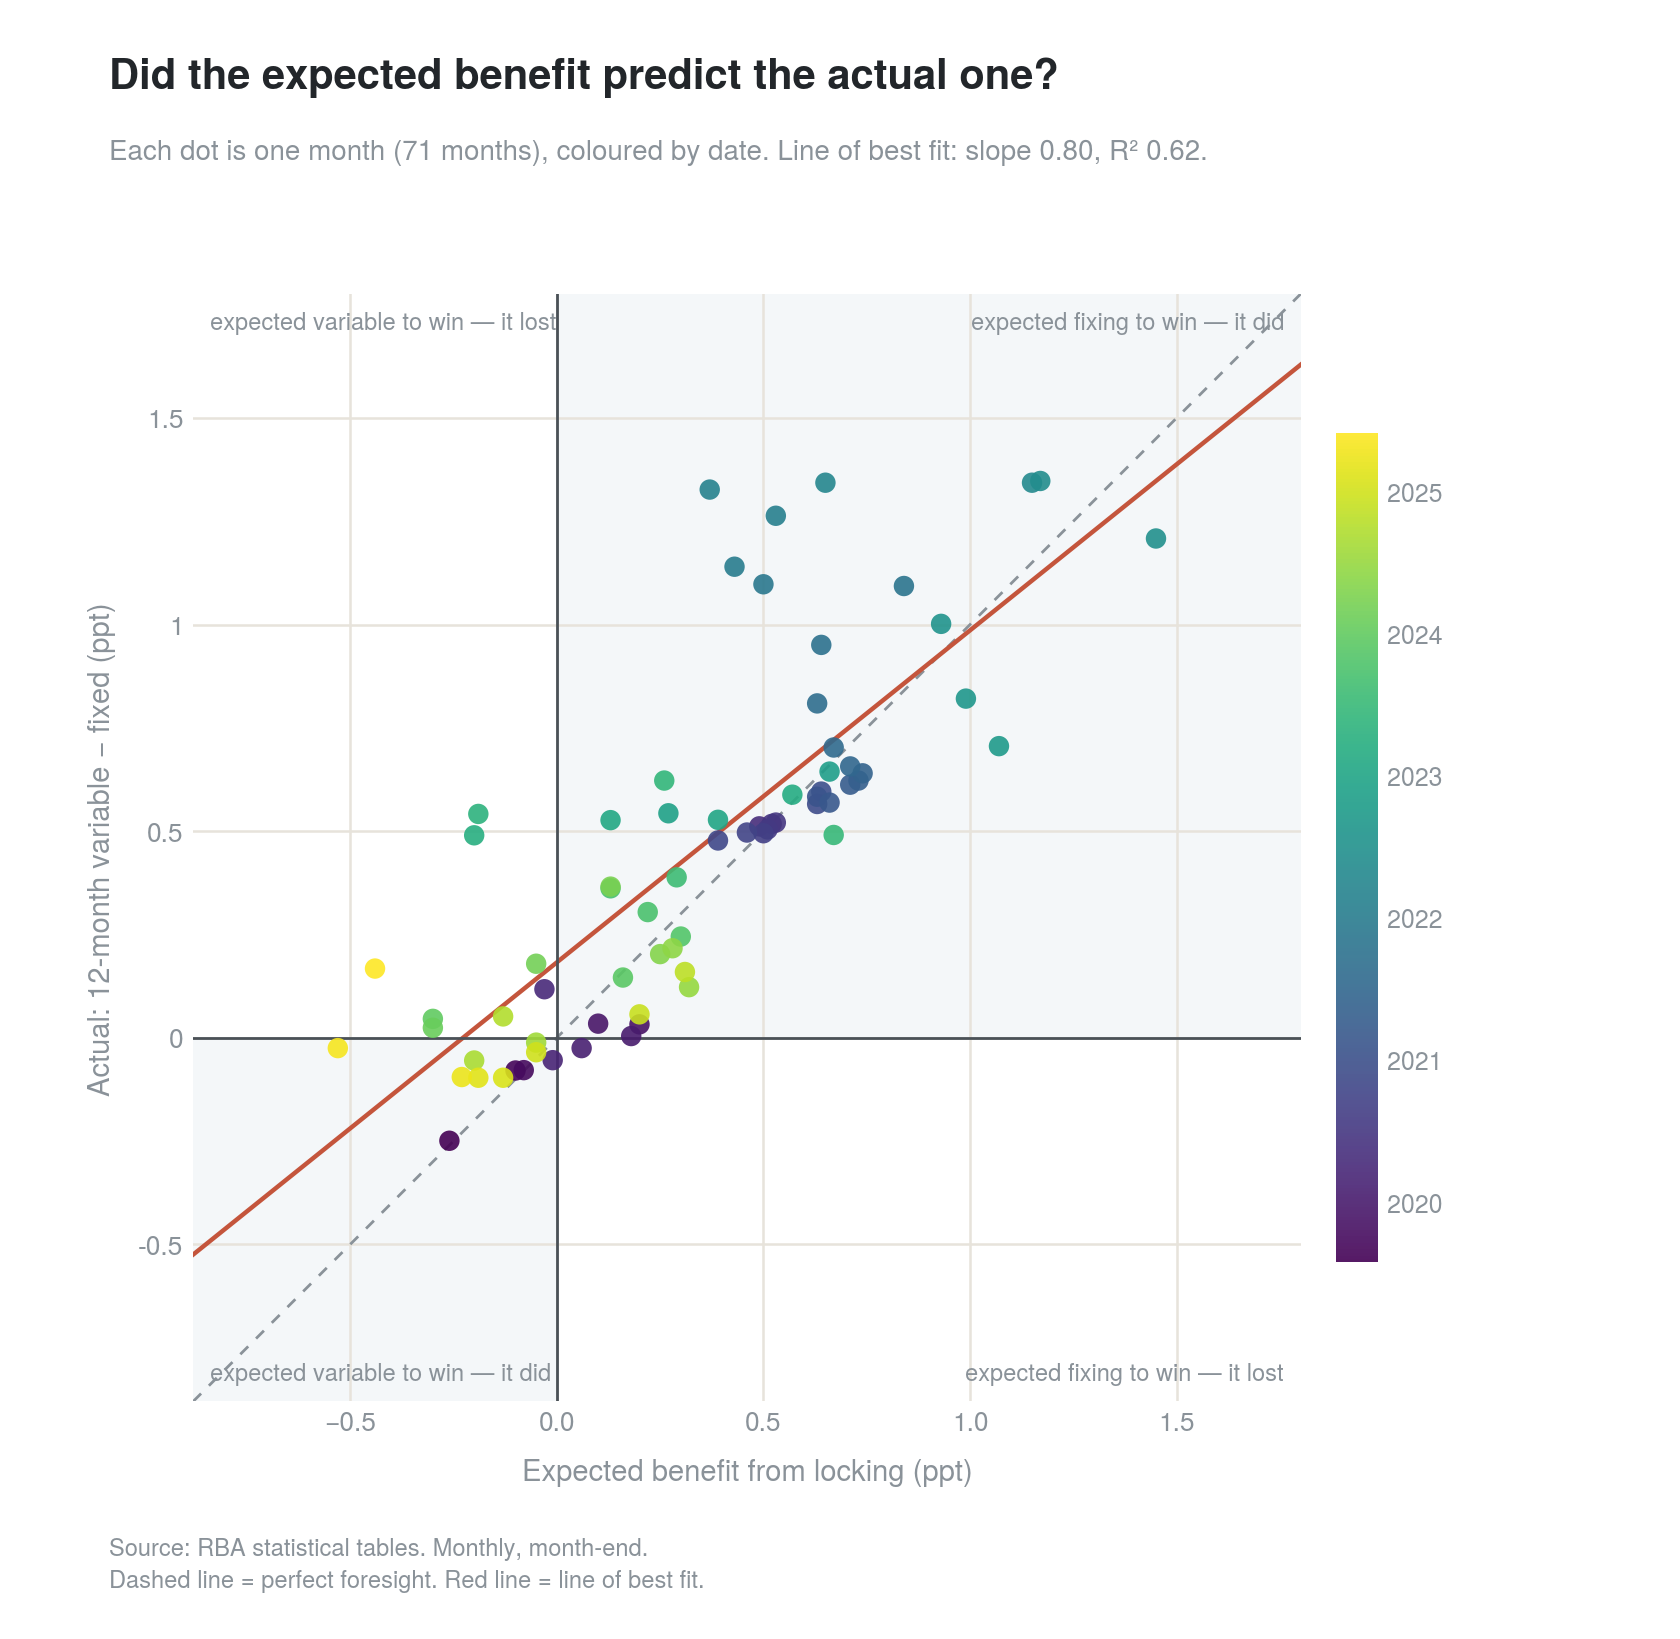
Covid was an extreme, once-off shock, and in particular had a structural difference in margin between fixed and variable that skewed the results positively.
Excluding that period gives a result more likely to reflect the future:
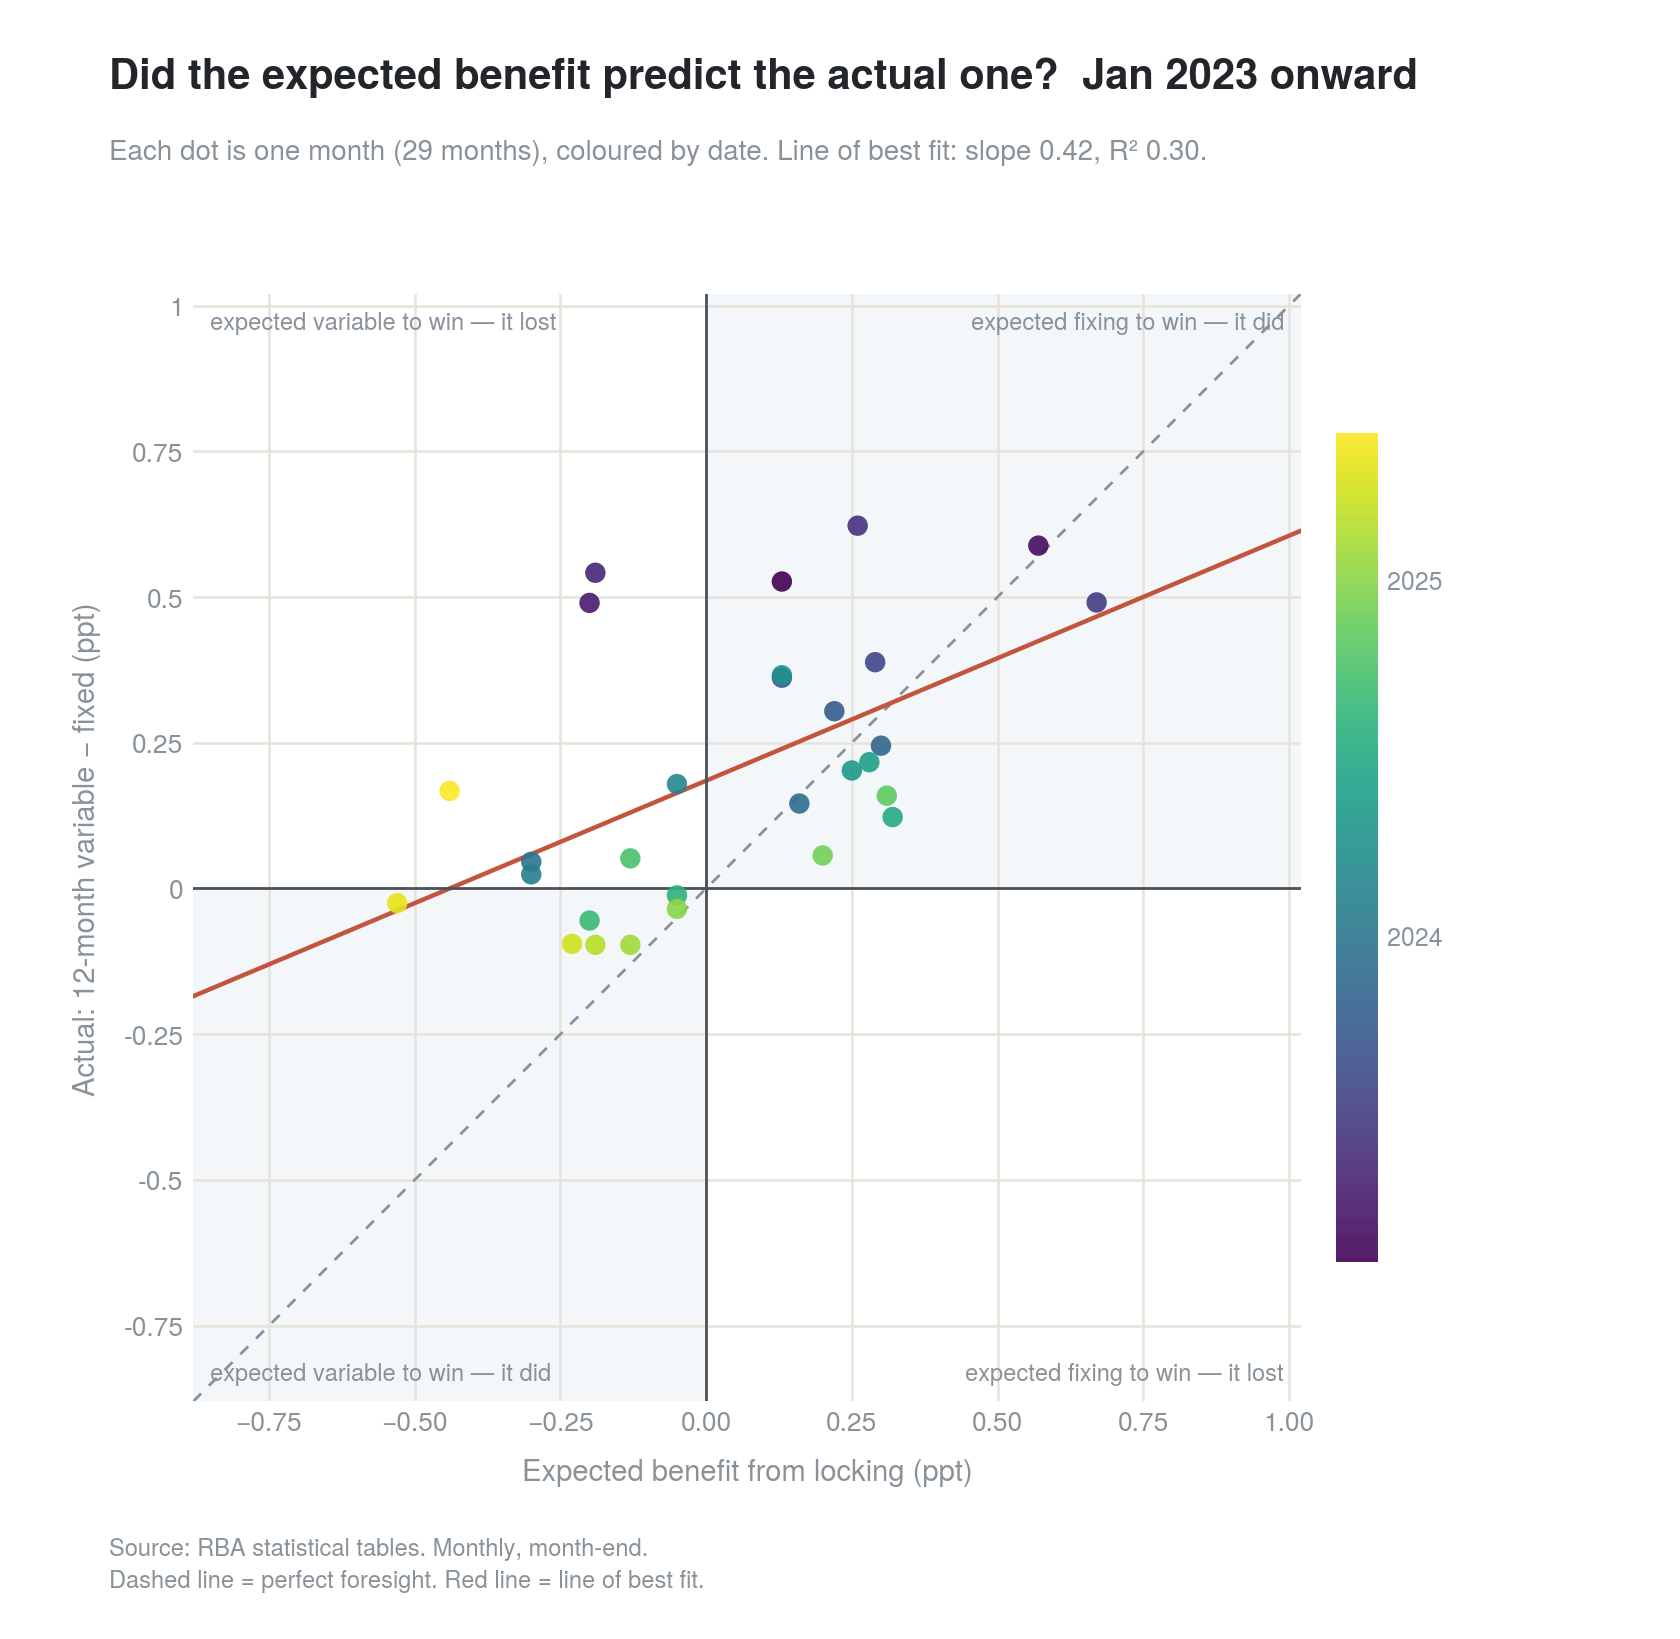
The strength of the relationship is much weaker, partly because we have seen much more stable interest rates, so we are not picking up the intended target of a hiking cycle or a cutting cycle. However we do see the signal pick up again in 2026.
A simple rule, with caveats
So, back to my earlier question of whether to lock in at a 0.7% expected benefit. That comes from two things. My variable rate of 5.27% against a 4.89% fixed offer is a 0.38% discount for fixing. And with the 1-year bond yield at 3.92% sitting above the 3.6% cash rate, the market is pricing a rise, worth another 0.32% (based on daily data, not the end-of-month figures used throughout): relative to history, that's strong, particularly as it's the first positive expected value outside the Covid period. I took the plunge and locked it in. As of writing this, I locked in at 4.89%, and the current variable rate on offer is ~6%, so I captured the full expected benefit, plus an extra rate hike by chance.
What is the signal saying right now?
As of August 2026, the expected benefit of fixing sits at +0.28% a mild fix signal, well off the +0.7% peak in late 2025. The big window of the cycle has closed as the hiking cycle has ended, the bond market is not predicting any rate changes. Keep an eye out for changes in the bond yields as this is where opportunity can present itself in the future.